資源簡介
用matlab產生3維的高斯分布,初學者的練習,r=linspace(0,3,500);
the=linspace(0,2*pi,500);
[rho,theta]=meshgrid(r,the);
[x,y]=pol2cart(theta,rho);
n=0;

代碼片段和文件信息
function?[?output_args?]?=?gaosi1(?input_args?)
%UNtitleD4?此處顯示有關此函數的摘要
%???此處顯示詳細說明
w0=0.5;
r=linspace(03*w0200);
eta=linspace(02*pi200)
[rhotheta]=meshgrid(reta);
[xy]=pol2cart(thetarho);
Iopt=exp(-2*rho.^2/w0^2);
surf(xyIopt);
shading?interp;
xlabel(‘位置/mm‘);
ylabel(‘位置/mm‘);
zlabel(‘相對強度/a.u.‘);
title(‘高斯強度分布‘);
axis([-3*w03*w0-3*w03*w001]);
colorbar;
colormap(‘hot‘);
box?on;
grid?off;


end
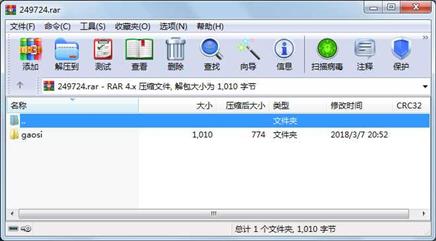
?屬性????????????大小?????日期????時間???名稱
-----------?---------??----------?-----??----
?????文件????????475??2018-03-07?15:27??gaosi\gaosi1.m
?????文件????????535??2018-03-07?15:32??gaosi\gaosi2.m
?????目錄??????????0??2018-03-07?20:52??gaosi
-----------?---------??----------?-----??----
?????????????????1010????????????????????3
- 上一篇:HookeJeeves優化程序
- 下一篇:matlab作smith chart
評論
共有 條評論
 川公網安備 51152502000135號